Electronegativity Chart A Comprehensive Guide to Understanding Atomic Interactions
electronegativity chart
Understanding the electronegativity chart is essential for anyone diving into the world of chemistry. Electronegativity is a fundamental concept that explains how atoms interact with electrons during chemical bonding. From ionic bonds to covalent ones, the ability of an atom to attract electrons determines the nature of these interactions. This article will provide an in-depth exploration of electronegativity, its role in chemical bonding, and how the electronegativity chart can be used to predict the types of bonds between atoms.
Table of Contents
What is Electronegativity?
Electronegativity refers to the tendency of an atom to attract electrons when it forms a chemical bond with another atom. In simpler terms, it tells us how strongly an atom “pulls” on shared electrons in a bond. This is crucial in determining the type of bond that will form between atoms—whether it will be ionic, covalent, or polar covalent.
The concept was first introduced by Linus Pauling in 1932. He developed a scale to quantify electronegativity, which is commonly known today as the Pauling scale. The electronegativity chart uses numerical values to represent the electronegativity of elements. These values typically range from about 0.7 (for cesium and francium) to 4.0 (for fluorine, the most electronegative element).
The Electronegativity Chart: An Overview
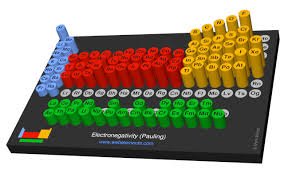
The electronegativity chart is a visual representation that shows the relative electronegativity values of all elements in the periodic table. These values help chemists predict how atoms will bond based on their electronegativity.
In the electronegativity chart, the elements are arranged in order of increasing electronegativity, starting from elements like cesium (0.79) in the lower left and moving toward fluorine (3.98) in the upper right. This chart is crucial for understanding trends in the periodic table and predicting the behavior of different elements when they combine chemically.
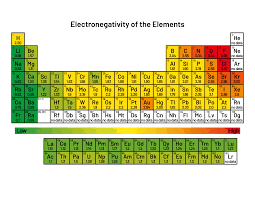
How to Read the Electronegativity Chart
The electronegativity chart can be interpreted with a basic understanding of periodic trends. As you move from left to right across a period (horizontal row) in the periodic table, electronegativity increases. This is because elements on the right have more protons, which exert a stronger pull on electrons. As you move down a group (vertical column), electronegativity decreases. This happens because the atomic radius increases, making it harder for the nucleus to attract electrons from bonding atoms.
In the electronegativity chart, elements with higher electronegativity values tend to be found in the upper right corner, while elements with lower values are typically located in the lower left corner. For example, fluorine, oxygen, and nitrogen are highly electronegative, while sodium, potassium, and cesium are among the least electronegative.
Electronegativity Trends Across the Periodic Table
To fully understand the electronegativity chart, it’s essential to recognize the periodic trends that dictate the electronegativity values:
- Across Periods: As you move from left to right across a period, electronegativity increases. This trend occurs because the atoms’ size decreases, and the nuclear charge increases, making it easier for the atom to attract electrons. For example, fluorine (F), which is located in the upper right of the periodic table, is highly electronegative compared to sodium (Na), which is located in the lower left.
- Down Groups: As you move down a group, electronegativity decreases. This is because the atomic radius increases, which results in electrons being farther from the nucleus. As a result, the atom’s ability to attract electrons weakens. Cesium (Cs), located in the lower left corner of the periodic table, has one of the lowest electronegativity values, while fluorine (F), located at the top right, has one of the highest.
Understanding Electronegativity and Bond Formation
The electronegativity chart plays a vital role in predicting the types of chemical bonds that will form between atoms. The electronegativity difference between two atoms determines whether they will form an ionic bond, covalent bond, or polar covalent bond.
- Ionic Bonds: When two atoms with a large electronegativity difference (greater than 1.7) form a bond, one atom will attract the shared electrons so strongly that it effectively steals electrons from the other atom. This results in the formation of an ionic bond. For example, when sodium (Na) bonds with chlorine (Cl), sodium loses an electron, and chlorine gains it, resulting in the formation of NaCl (table salt).
- Covalent Bonds: When the electronegativity difference between two atoms is small (less than 0.4), the electrons are shared equally between the atoms. This results in a nonpolar covalent bond. For example, the bond between two oxygen atoms in O2 is nonpolar because both atoms have the same electronegativity value.
- Polar Covalent Bonds: If the electronegativity difference between two atoms is between 0.4 and 1.7, the electrons are shared unequally, creating a polar covalent bond. One atom will have a partial negative charge (δ-) and the other will have a partial positive charge (δ+). A classic example of this is the bond between hydrogen and oxygen in water (H2O). Oxygen is more electronegative than hydrogen, resulting in a polar molecule.
How Electronegativity Affects Molecule Behavior

Understanding the electronegativity chart is not only important for predicting bond types but also for understanding molecular behavior. The distribution of electron density in a molecule can influence its physical and chemical properties, including polarity, solubility, and reactivity.
For example, molecules with polar covalent bonds, such as water (H2O), tend to have distinct ends with opposite charges. This dipole moment makes water an excellent solvent for other polar substances and influences its ability to form hydrogen bonds. In contrast, nonpolar molecules like nitrogen (N2) or oxygen (O2) do not have a dipole moment and tend to behave differently in chemical reactions and physical processes.
Applications of Electronegativity in Real-World Chemistry
The concept of electronegativity, as depicted in the electronegativity chart, has numerous applications in various fields of chemistry and material science. Some of these applications include:
- Organic Chemistry: In organic chemistry, understanding electronegativity helps in predicting the behavior of functional groups in different molecules. Electronegativity plays a key role in determining the reactivity of certain bonds and how molecules interact in reactions like nucleophilic substitution or electrophilic addition.
- Pharmaceutical Chemistry: The design of pharmaceutical compounds often relies on the knowledge of electronegativity. The interactions between molecules, including receptor binding and enzyme inhibition, can be predicted based on electronegativity differences between atoms in the molecule.
- Environmental Chemistry: Electronegativity also plays a role in environmental chemistry, especially in the study of pollutants and toxins. Understanding how different elements interact with environmental systems can help chemists design better ways to neutralize or remove pollutants from water, air, and soil.
- Material Science: In material science, electronegativity helps predict the properties of materials, such as conductivity, hardness, and resistance to corrosion. For example, in semiconductor technology, the electronegativity of elements like silicon (Si) and germanium (Ge) is critical to their ability to function in electronic devices.
Factors Influencing Electronegativity
Several factors contribute to the electronegativity of an element, which are evident when examining the electronegativity chart. These factors include:
- Atomic Radius: The size of the atom plays a significant role in determining electronegativity. Smaller atoms tend to have higher electronegativity because the electrons are closer to the nucleus and more strongly attracted.
- Nuclear Charge: The number of protons in an atom’s nucleus affects its electronegativity. Atoms with a higher number of protons exert a stronger force on the electrons, increasing their electronegativity.
- Electron Shielding: Electron shielding refers to the ability of inner-shell electrons to reduce the attraction between the nucleus and the outer-shell electrons. More shielding results in lower electronegativity.
Also read Caldo de Res La Sopa Mexicana que Reconforta el Alma
Conclusion
The electronegativity chart is a vital tool for understanding the nature of chemical bonds and molecular interactions. By exploring the concepts of electronegativity, atomic structure, and periodic trends, chemists can predict how atoms will behave in different chemical reactions. Whether you’re studying basic chemistry or working in advanced scientific research, understanding electronegativity is crucial for a deeper understanding of how elements combine to form compounds.
In summary, the electronegativity chart is more than just a collection of numbers. It is a key to understanding the interactions between atoms, predicting the types of chemical bonds they will form, and grasping the underlying principles of molecular behavior. From the simplest molecules to complex compounds, electronegativity remains a cornerstone of modern chemistry.